Color Coverage Examples
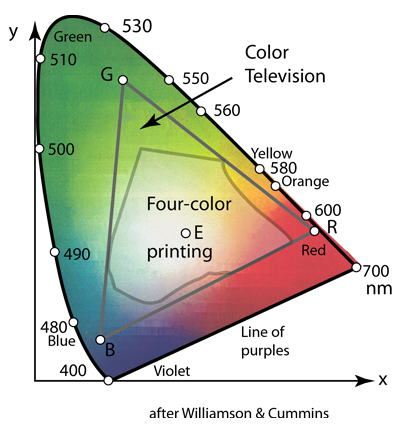 |
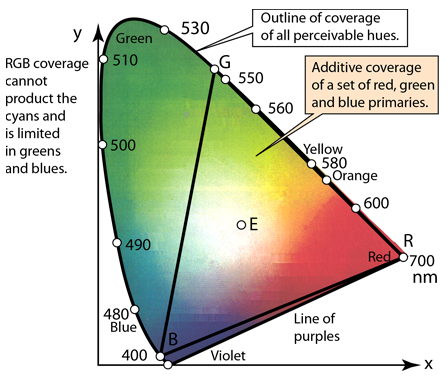
One of the uses of the CIE chromaticity diagram is to show what part of the human color perception range can be covered by various color imaging methods. The outline shows the full range of perceivable colors. The triangle outlines the range covered by red, green, and blue phosphors on a CRT-type color television screen, and the inner diagram shows the range available to commercial four-color printing processes. The range of colors accessible to a given process is called it's "gamut".
|
CIE concepts
Vision concepts
Color vision concepts
Reference
Williamson & Cummins
Ch 3
| HyperPhysics***** Light and Vision | R Nave |