Experimenting with the past: astronomical measurements

Distances to "close" stars can be measured by the apparent position shift 6 months apart in Earth's orbit.

If you know how bright a star is, you can measure it's distance by the "standard candle" technique, making use of the geometry of the inverse square law.

Cepheid variable stars have periods proportional to their absolute brightness. 273 were found within parallax range. They are used as "standard candles" to calculate their distances. They are visible and measurable to 20 million light years.

A much brighter standard candle is the Type 1a supernova, which is rarer but has a more constant brightness.

The workhorse distance-measuring tool is the Hubble law, from observations of the expansion of the universe and the Doppler-shift of atomic-fingerprint spectra. The increase of recession speed with distance allowed a backprojection to a time when it started, but for many years the Hubble constant was uncertain by a factor of two or so. Nevertheless, it indicated a look-back time in the billions of years.

With the WMAP probe, much greater precision came into our measurement of the background radiation at 2.725 K and a more precise Hubble constant led to a look-back time of 13.7 billion years.


Outline
A brief overview of time
References
 
Book of NatureR Nave
Go Back


Stellar Parallax

A nearby star's apparent movement against the background of more distant stars as the Earth revolves around the Sun is referred to as stellar parallax.

This exaggerated view shows how we can see the movement of nearby stars relative to the background of much more distant stars and use that movement to calculate the distance to the nearby star.

With the aid of the Hipparcos satellite, we have measured parallax distances out to 200 parsecs or about 650 light years. With the Hipparcos satellite, we are then seeing today things that happened 650 years ago. Hipparcos was able to measure 273 Cepheid variable stars, which serve as standard candles for more distant measurements.


Outline
Experimenting with the past: astronomical measurements
References
 
Book of NatureR Nave
Go Back


Standard Candle Approach to Distance Measurement


Outline
Experimenting with the past: astronomical measurements
References
 
Book of NatureR Nave
Go Back


Cepheid Variable Distances

Named after delta-Cephei, the Cepheid Variables are the most important type of variable because it has been discovered that their periods of variability are related to their absolute luminosity. This makes them invaluable as a contributer to astronomical distance measurement. The periods are very regular and range from 1 to 100 days.

The shape of the Cephiad luminosity curve is often referred to as a "shark fin" shape when plotted as magnitude vs period. It should be noted that the smooth curve is an average behavior. There is considerable scatter about such a curve, at least in the observations.

Cepheid variables can be seen and measured out to a distance of about 20 million light years. The phenomena observed there were happening 20 million years ago.

The above period-luminosity curve plotted as a function of multiples of the Sun's luminosity (Bennett, et al.) shows the kind of scatter in the dependence of absolute luminosity on period. A Cepheid variable nevertheless gives a good indication of distance when used as a standard candle. The distances to 273 such Cepheid variables were measured directly by stellar parallax by the Hipparcos satellite.


Outline
Experimenting with the past: astronomical measurements
References
 
Book of NatureR Nave
Go Back


Type Ia Supernovae

Type Ia supernovae have become very important as the most reliable distance measurement at cosmological distances, useful at distances in excess of 3 billion light years.

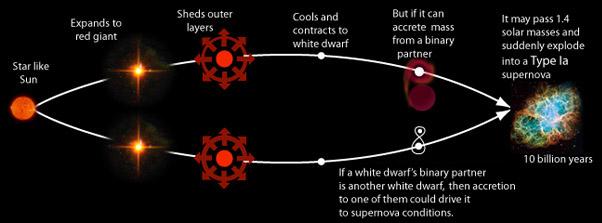
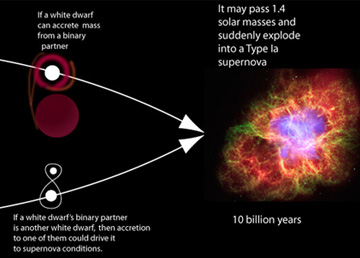
One model for how a Type Ia supernova is produced involves the accretion of material to a white dwarf from an evolving star as a binary partner. If the accreted mass causes the white dwarf mass to exceed the Chandrasekhar limit of 1.44 solar masses, it will catastrophically collapse to produce the supernova. Another model envisions a binary system with a white dwarf and another white dwarf or a neutron star, a so-called "doubly degenerate" model. As one of the partners accretes mass, it follows what Perlmutter calls a "slow, relentless approach to a cataclysmic conclusion" at 1.44 solar masses. A white dwarf involves electron degeneracy and a neutron star involves neutron degeneracy.

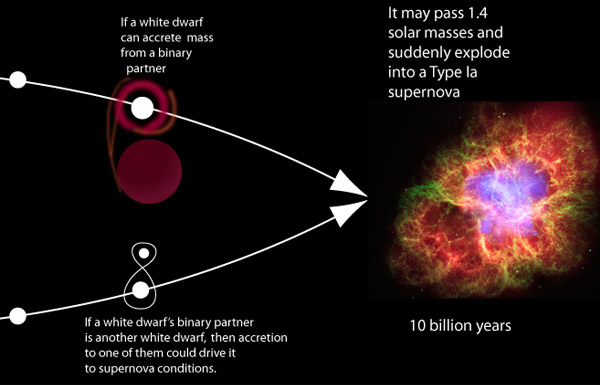
A critical aspect of these models is that they imply that a Type Ia supernova happens when the mass passes the Chandrasekhar threshold of 1.44 solar masses, and therefore all start at essentially the same mass. One would expect that the energy output of the resulting detonation would always be the same. It is not quite that simple, but they seem to have light curves that are closely related, and can be related to a common template.


Outline
Experimenting with the past: astronomical measurements
References
 
Book of NatureR Nave
Go Back


The Expansion of the Universe Gives Us a Measuring Stick for Distance


Hydrogen spectrum

Every element has a unique spectral fingerprint of colors emitted. For distant luminous gases in stars, we see that unique pattern shifted toward the red by an amount proportional to the star's speed relative to us.


Outline
Experimenting with the past: astronomical measurements
References
 
Book of NatureR Nave
Go Back


The Wilkinson Microwave Anisotropy Probe (WMAP)

The WMAP mission has provided the first detailed full-sky map of the microwave background radiation in the universe. The map produced is characterized as a map of the effective temperature of the microwave background radiation as depicted below. This is a synopsis of the description of the mission from the WMAP mission report on the NASA website. The illustrations are NASA graphics.

Note that the temperature variation on the Earth covers about 100°C while those measured by WMAP range only over about 0.0004 °C, a smaller range by a factor of a quarter of a million.

The wavelengths of radiation detected by WMAP were in the microwave region of the electromagnetic spectrum as depicted in the NASA graphic below.

The synopsis of the implications of WMAP as summarized in the mission report includes the following quote from the WMAP site:

  • Universe is 13.7 billion years old, with a margin of error close to 1%.
  • First stars ignited 200 million years after the Big Bang.
  • Light in WMAP picture is from 379,000 years after the Big Bang.
  • Content of the Universe:
    • 4% Atoms, 23% Cold Dark Matter, 73% Dark Energy.
    • The data places new constraints on the Dark Energy. It seems more like a "cosmological constant" than a negative-pressure energy field called "quintessence". But quintessence is not ruled out.
    • Fast moving neutrinos do not play any major role in the evolution of structure in the universe. They would have prevented the early clumping of gas in the universe, delaying the emergence of the first stars, in conflict with the new WMAP data.
  • Expansion rate (Hubble constant) value: H0 = 71 km/sec/Mpc (with a margin of error of about 5%.
  • New evidence for Inflation (in polarized signal).
  • For the model which fits our data, the Universe will expand forever. The density parameter Ω is measured to be 1.02 +/- 0.02 . (The nature of the dark energy is still a mystery. If it changes with time, or if other unknown and unexpected things happen in the universe, this conclusion could change.)


Outline
Experimenting with the past: astronomical measurements
References
 
Book of NatureR Nave
Go Back