Electroencephalograph (EEG)
The electroencephalogram (EEG) is a recording of electrical signals produced by the brain. Usually the measurements are made from electrodes placed on the scalp. The signal strengths involved are much lower than those involved in the ECG. The voltages measured are on the order of 50 microvolts, compared to about a millivolt for the ECG. Consequently, the signals must be amplified by factors of several thousand to be recorded. This makes the problems of stray signals and electrical noise more severe than with the ECG.
The EEG signals cannot be correlated with specific brain activity as precisely as the ECG pulses can be related to heart cycle, but many years of experimentation have produced definite correlations with the physiological state. The signals are composed of roughly periodic oscillations of varying frequencies. Much of the information is contained in the frequencies of the waves. To facilitate analysis, the various frequencies have been divided into bands as indicated in the table below.
| The alpha waves are associated with the relaxed but alert state. During sleep the alpha waves decrease, and the presence of the delta waves indicates deep sleep. The delta waves are strong and dominant when the patient is in a comatose state. Further interpretation can be made in terms of the size and shape of the waveforms. | |||||||||||||||
| The EEG has been of considerable value in diagnosing epilepsy, tumors, certain forms of drug addiction, and various other brain-related diseases. Since there is normally a continuous activity in the brain as indicated by the EEG, even during deep sleep, the absence of any EEG signal over a long period of time has been used as one criterion for death. This is an EEG associated with a diagnosis of epilepsy (courtesy Wikipedia). | 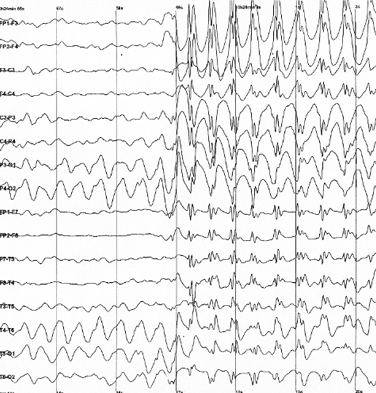 |
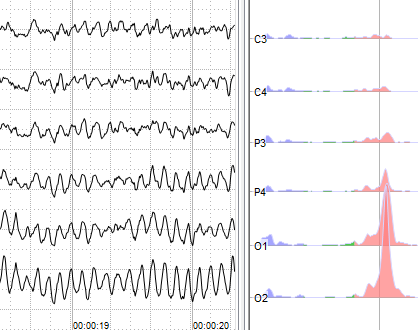 | This EEG shows prominent alpha waves. At the right in the illustration is the power spectrum, showing the alpha waves at 11Hz in red. The leads showing the most prominent alpha waves are described as the posterior leads. Image from Wikipedia, see Ref. Credited to Andrii Cherninskyi. |
Health-related applications
Bioelectricty
EEG Wiki
Nave & Nave
Ch. 16
| HyperPhysics***** Biology | R Nave |