Cavity Resonance
The purpose of this experiment is to explore the resonant behavior of an acoustic cavity (a coke bottle). Recall that a resonant frequency is defined as a natural frequency of vibration which is determined by the physical properties of the vibrating object. In this case the physical properties which affect the natural frequency of the cavity are its volume, area of opening, and length of opening port. In this experiment, only the effects of changing volume will be explored since the other factors are not easily changed.
The apparatus consists of a coke bottle, a graduated cylinder, and a digital computer interface with which to produce a digital image of the sound made by blowing over the coke bottle.
Procedure: Setup of Computer Interface:
- Connect the Sound Sensor to port A, Analog Inputs, Pasco 850
- Open the Capstone software on the laptop.
- From the column of displays on the right, drag Scope onto the display area.
- From "Hardware Setup" on left, choose Pasco 850.
- Click on Analog Input A and choose Sound Sensor (s on keyboard will take you to it). Click the "Hardware Setup" button again to clear that window.
- For the horizontal axis choose Time, and for the vertical axis Sound Intensity, Channel A.
- Set Sound Sensor to 2.5 kHz as a reasonable initial value - then you can experiment with other settings if you choose.
- Produce sound, click Record, then click again to stop recording.
- Position the mouse over the Time label to get a set of horizontal arrows that you can drag to spread out the sound display until you get a clear display of at least 10 periods. A reasonable starting point is about 0.1 seconds full width of the window. For the vertical or voltage scale, +/- 2 volts is a reasonable starting range.
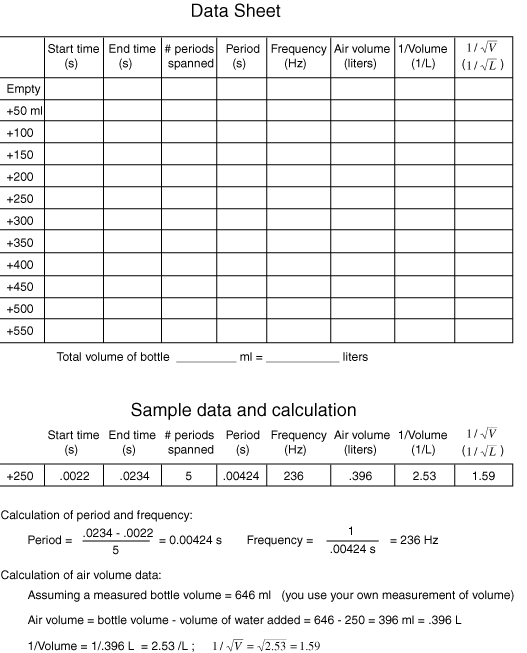
- Use the Coordinate tool to measure a start time for one of the wave peaks, then move 10 periods and measure the time, then divide by 10 to get the period in seconds. Calculate the frequency. You can just click on the Coordinate tool to place a measurement box on the screen. If you wish, you can leave the initial measurement in place and click on the Coordinate tool again to place a second measurement box at the end of 10 periods.
Comments on Data Collection:
- To produce a cleaner sound waveform, place the sensor just behind the coke bottle, and just low enough so that you are not blowing directly on the sensor.
- Experiment with the vertical sensitivity and the horizontal time axis to get a clearly defined sinusoidal pattern.
- Repeat the process after adding 50 ml (same as cm3) of water from a graduated cylinder. Continue adding water in 50 ml amounts and taking data until you have filled the coke bottle. Fill the bottle completely and determine the total volume of air so that you can work backwards to get the volume of air for each of your measurements.
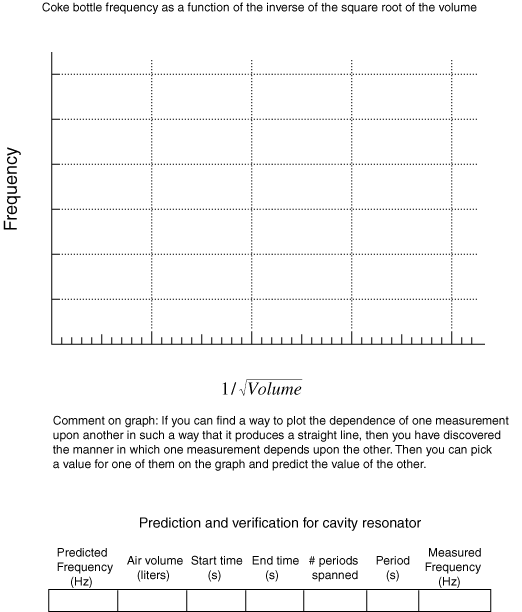
- Plot your data with frequency in Hz on the vertical axis and your column of values for one divided by the square root of volume on the horizontal axis.
Prediction-verification:
- Determine the value on the horizontal axis of your graph which corresponds to the frequency of middle-C (262 Hz). Calculate the corresponding air volume and add enough water to produce that air volume.
- Take data as in step 10 above to determine the frequency of the cavity.

