Factory Sound Measurements

How do you use a combination of A contour and straight decibels measurements to reliably assess a sound field? For a discussion of the interpretation of the measurements in a given area, click on that area in the illustration below.

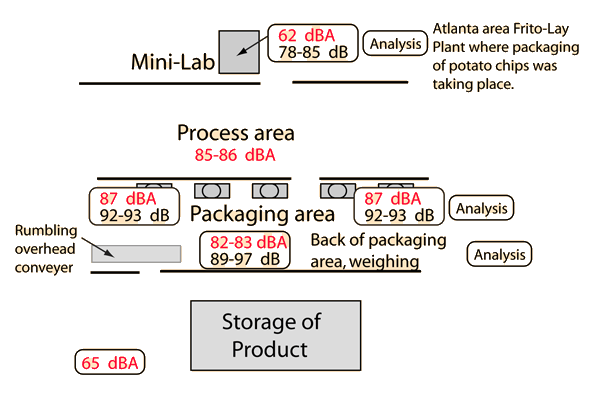
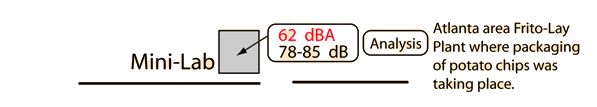
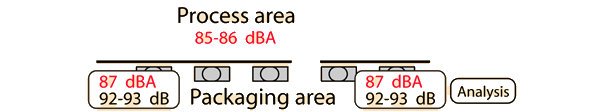
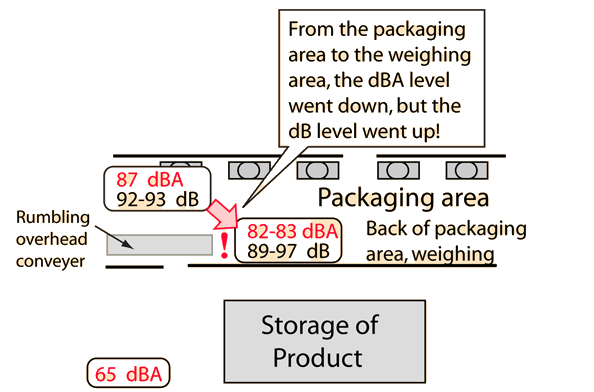
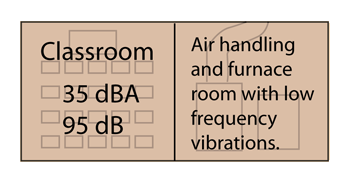
The measurements in this factory area were made with a research-quality sound-level meter which had a certified "flat to 20 kHz" range which gave legitimate dB measurements. Most survey sound-level meters have just two options: dBA and dBC. This is because low-cost sound survey meters will not have a certified dB scale, but can meet the standards for dBC which has a small discrimination against very high and very low sounds. Practically, dBC and dB are essentially the same. So good practice for a sound survey with such a meter would be to measure in both dBA and dBC in every location. The difference between them gives you information about the frequency distribution of the sound and helps to avoid misleading results in cases where there is a significant change in the frequency distribution in different measurement locations.

Index

Hearing concepts

Sound level measurement

Sound measurement examples

Reference
Backus
 
HyperPhysics***** Sound R Nave
Go Back


Factory Sound Measurements

These sound measurements were made in a small quality-control lab some 15 meters from the packaging line. The A contour measurement of 62 dBA indicates that a comfortable level for working has been established by soundproofing this lab. The level inside the small lab was noticeably lower than that just outside its door. The large difference between the A-contour and straight decibel reading is an indication that there is a preponderance of low-frequency sound background in the lab. This is to be expected, since it is more difficult to remove low frequency noise. Low frequency sounds are more efficiently structure-borne than high frequencies, so that insulation in walls, etc. is not as effective in removing the lows. The low frequencies will come in on the structural supports of the enclosure.

Statement of example
Index

Hearing concepts

Sound level measurement

Sound measurement examples
 
HyperPhysics***** Sound R Nave
Go Back


Factory Sound Measurements

The sound level was quite high in the area where high-speed packaging equipment was operating. The level of 87 dBA is just under the level where OSHA requirements dictate the provision of hearing protection if employees are subjected to it for 8 hours.

Such hearing protection in the form of ear covers had been provided. Sets were hanging around in the packaging area, but no employees were wearing them. The small difference of 5-6 dB between the A contour and straight decibel measurements indicates that most of the sound energy was at mid-range frequencies where the A-contour and the human ear are most receptive.

Statement of example
Index

Hearing concepts

Sound level measurement

Sound measurement examples
 
HyperPhysics***** Sound R Nave
Go Back


Factory Sound Measurements

A sound measurement puzzle: when you went from the packaging area to the weighing area, the level in dBA went down but the measured level in dB went up!! How can that be? In the weighing area, a rumbling conveyer belt took packaged product to an upper floor. The increase in that low frequency, partially inaudible sound drove the decibel level up. The increase in distance from the loud packaging machines dropped the audible sound level.

This demonstrates the fact that it is good practice to measure sound fields in both flat dB and dBA in sound surveys. It helps to characterize the differences in sound frequency distributions in different locations and allows you to explain puzzling measurements like those above. For low-cost sound survey meters, there is usually a switch allowing you to switch from dBA to dBC(which is close to flat dB), so you could just switch back and forth from A to C contours at each measurement location.

Statement of example
Index

Hearing concepts

Sound level measurement

Sound measurement examples
 
HyperPhysics***** Sound R Nave
Go Back


School Sound Measurements

A survey of sound level in some elementary school classrooms turned up the largest discrepancy between A-contour and flat decibel measurements that the author has seen. In a particular school there was a ground floor classroom next to the main air handling units for the school which yielded an astounding 60 dB difference between dBA and dB measurement.

This highlights the futility of doing only flat decibel measurements inside of buildings. A combination of dB and dBA measurements gives a fairly balanced picture of the sound environment. In this extraordinary case, a great deal of effort had been made to sound-insulate the air-handling room, and this effort had indeed greatly reduced the audible sound transmission into the classroom. But very low frequency sounds vibrate the structures and are much more efficiently structure-borne to different locations in the building. The room was indeed fairly quiet to the ear, although you could feel a bit of the vibration in the floor. Some of that low frequency vibration was picked up by the high quality sound level meter when it was set to measure decibels, even though the ear was barely aware of it and the A-contour filter of the meter appropriately eliminated it.

Index

Hearing concepts

Sound level measurement

Sound measurement examples
 
HyperPhysics***** Sound R Nave
Go Back