Davisson-Germer Experiment
 Davisson, C. J., "Are Electrons Waves?," Franklin Institute Journal 205, 597 (1928) |
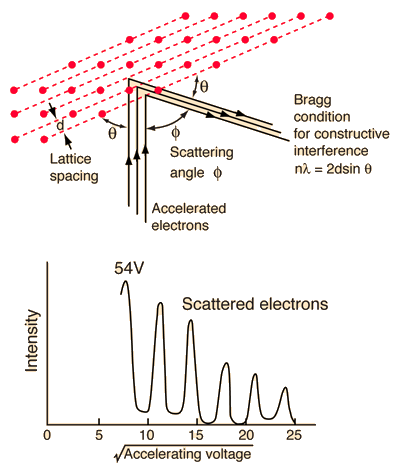
The Davisson-Germer experiment demonstrated the wave nature of the electron, confirming the earlier hypothesis of deBroglie. Putting wave-particle duality on a firm experimental footing, it represented a major step forward in the development of quantum mechanics. The Bragg law for diffraction had been applied to x-ray diffraction, but this was the first application to particle waves. Davisson and Germer designed and built a vacuum apparatus for the purpose of measuring the energies of electrons scattered from a metal surface. Electrons from a heated filament were accelerated by a voltage and allowed to strike the surface of nickel metal. |
The electron beam was directed at the nickel target, which could be rotated to observe angular dependence of the scattered electrons. Their electron detector (called a Faraday box) was mounted on an arc so that it could be rotated to observe electrons at different angles. It was a great surprise to them to find that at certain angles there was a peak in the intensity of the scattered electron beam. This peak indicated wave behavior for the electrons, and could be interpreted by the Bragg law to give values for the lattice spacing in the nickel crystal.
The experimental data above, reproduced above Davisson's article, shows repeated peaks of scattered electron intensity with increasing accelerating voltage. This data was collected at a fixed scattering angle. Using the Bragg law, the deBroglie wavelength expression, and the kinetic energy of the accelerated electrons gives the relationship
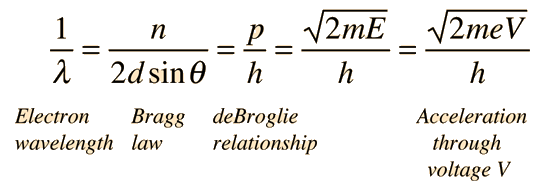
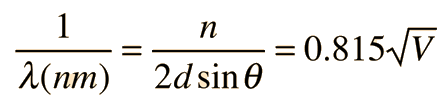
In the historical data, an accelerating voltage of 54 volts gave a definite peak at a scattering angle of 50°. The angle theta in the Bragg law corresponding to that scattering angle is 65°, and for that angle the calculated lattice spacing is 0.092 nm. For that lattice spacing and scattering angle, the relationship for wavelength as a function of voltage is empirically
Trying this relationship for n=1,2,3 gives values for the square root of voltage 7.36, 14.7 and 22, which appear to agree with the first, third and fifth peaks above. Then what gives the second, fourth and sixth peaks? Perhaps they originate from a different set of planes in the crystal. Those peaks satisfy a sequence 2,3,4, suggesting that the first peak of that series would have been at 5.85 . That corresponds to an electron wavelength of 0.21 nm and a lattice spacing of 0.116 nm ?? I don't know if that makes sense. I need to look at the original article.
| DeBroglie wavelength | Electron wave property |
Great experiments of physics
Reference
Rohlf
Ch 5
| HyperPhysics***** Quantum Physics | R Nave |