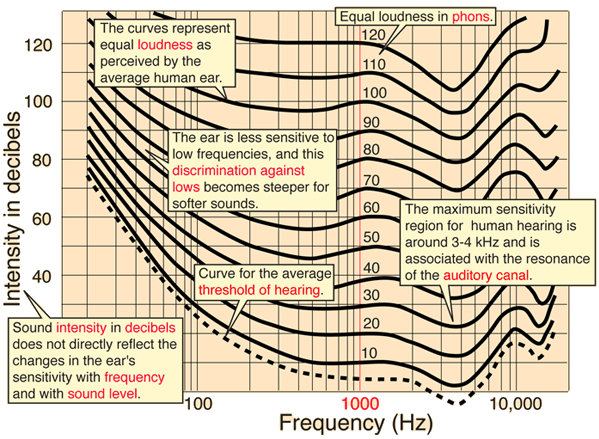
Equal Loudness Curves
Fletcher and Munson are credited with pioneering work in the 1930s to develop equal-loudness curves, contributing significantly to the understanding of the loudness response of the human ear. Sets of equal-loudness contours are still often referred to as Fletcher-Munson curves. The above curves follow the equal-loudness curves resulting from the measurements of Robinson and Dadson in the mid 1950s and are adapted from the depiction of the curves in Donald Hall's book "Musical Acoustics". Subsequent measurements of the human ear's loudness response were standardized under the designation ISO 226 Standard.

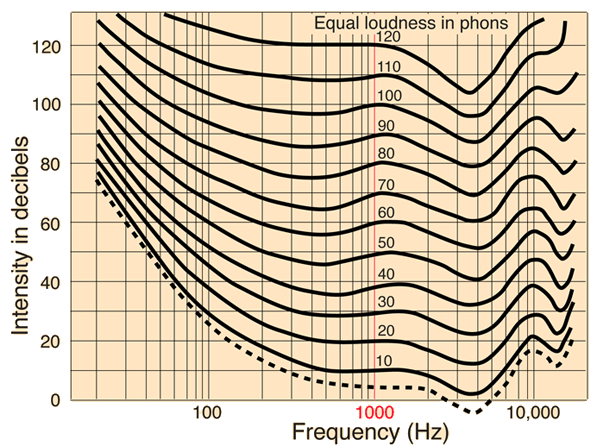
This illustration seeks to show the difference between the more recent ISO 226:2003 set of equal-loudness curves and the Robinson & Dadson curves. Most notable is the fact that the curves are steeper in the low to mid loudness levels for low frequencies. The measurements were made with individuals of normal hearing in the 18-25 year age range.
| Add discussion of curves as annotation |
| Example of information obtained from the curves. |
Hearing concepts
References:
Donald Hall
Ch 6, Fig 6:12
ISO 226:2003 Standard
Equal Loudness wiki
| HyperPhysics***** Sound | R Nave |