Diffraction Spectrometry, Fall 2001
Group I
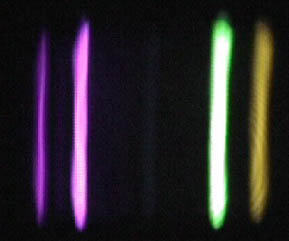
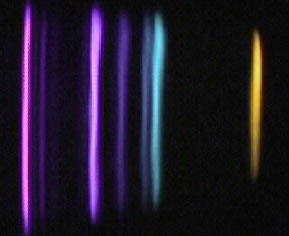
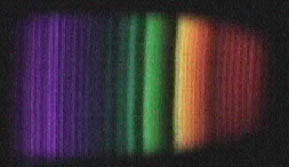
A study of Hydrogen, Helium, Nitrogen, Neon in excitation was conducted. This data was collected using a rotating arm spectrograph. The spectrograph data was drawn in the first node diffraction pattern from both the left and the right of the centerline of the grating. An average of the data was collected. The resulting angle was used to calculate the frequency of the escaping gamma.
Materials-
Experimental errors- Experimental errors occurring during the data collection were as follows.
Data-
|
Phys 3401 Lab |
||||
|
M. Cook & Jeff Stamper |
||||
|
Grating size(mm) |
600 |
dSin f= ml |
||
|
Visible Light ~ 420-670 |
||||
|
Helium |
||||
|
|
Left |
Right |
mean |
l (nm) |
|
16.00 |
15.50 |
15.8 |
452 |
|
|
16.90 |
16.40 |
16.7 |
478 |
|
|
17.90 |
17.30 |
17.6 |
504 |
|
|
18.20 |
17.50 |
17.9 |
511 |
|
|
21.40 |
20.50 |
21.0 |
596 |
|
|
24.40 |
23.60 |
24.0 |
678 |
|
|
25.80 |
25.00 |
25.4 |
715 |
|
|
|
standard deviation |
3.77 |
||
|
Mercury |
||||
|
Left |
Right |
mean |
l (nm) |
|
|
13.00 |
14.20 |
13.60 |
392 |
|
|
14.40 |
15.70 |
15.05 |
433 |
|
|
19.00 |
19.70 |
19.35 |
552 |
|
|
20.10 |
20.80 |
20.45 |
582 |
|
|
|
standard deviation |
3.30 |
||
|
Neon |
||||
|
Left |
Right |
mean |
l (nm) |
|
|
18.00 |
20.00 |
19.0 |
543 |
|
|
19.80 |
21.90 |
20.9 |
593 |
|
|
22.40 |
23.30 |
22.9 |
647 |
|
|
23.50 |
24.10 |
23.8 |
673 |
|
|
|
standard deviation |
2.14 |
||
|
Nitrogen |
||||
|
Left |
Right |
mean |
l (nm) |
|
|
14.50 |
15.50 |
15.0 |
431 |
|
|
18.90 |
20.00 |
19.5 |
555 |
|
|
19.90 |
21.50 |
20.7 |
589 |
|
|
22.00 |
23.90 |
23.0 |
650 |
|
|
|
standard deviation |
3.35 |
||
|
hydrogen |
||||
|
left |
right |
mean |
l (nm) |
|
|
15.5 |
14.6 |
15.05 |
433 |
|
|
17.3 |
16.4 |
16.85 |
483 |
|
|
21 |
20.3 |
20.65 |
588 |
|
|
23.8 |
22.8 |
23.3 |
659 |
|
|
standard deviation |
3.716 |
|||