Muestra de Vocales como Función del Tiempo y de la Frecuencia

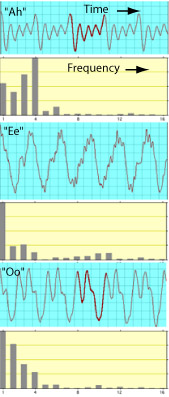
El examen de la cualidad distinguible de la voz o timbre de sonidos vocales, se realiza con dos tipos diferentes de muestras del sonido. La visualización de la imagen del sonido como función del tiempo demuestra que las formas de ondas de los tres sonidos vocales son claramente diferentes. Este es el tipo más común de visualización según lo captura un osciloscopio o una pantalla de ordenador.

El segundo tipo de pantalla muestra la imagen de sonido como función de la frecuencia. Este es un ejemplo de análisis de Fourier, y estas gráficas que muestran la cantidad de señal asociada con cada armónico de la señal de sonido, se llaman transformadas rápidas de Fourier, o FFTs. La FFT proporciona una manera de cuantificar las diferencias en el contenido armónico de los sonidos de las vocales, y proporciona una idea de cómo el oído distingue estos sonidos de vocales. Con el conocimiento proporcionado por la teoría del lugar de la percepción del tono, se puede observar que el análisis del oído humano de la cualidad del sonido tiene cierta semejanza con una FFT.

Estas muestras fueron creadas por Elisha Huggins con MacScope2.

Índice

Conceptos de Voz

Instrumentos Musicales

Referencia
Benade
Cap. 19
 
HyperPhysics*****SonidoM Olmo R Nave
Atrás


Vowel Displays as a Function of Time and Frequency

Thanks to Katherine Marks for her permission to use vowel sounds she produced to illustrate how the ear detects the difference.

The inner ear acts as a sophisticated sound analyzer, spreading out the energy content of the sound as a function of frequency. As shown here for three vowel sounds, the result is a distinguishable pattern of excitation on the basilar membrane of the cochlea. This permits the clear distinguishing of vocal sounds even if they have identical pitch and loudness.

The examination of the distinguishable sound quality or timbre of vowel sounds is aided by two different types of displays of the sound. The display of the sound image as a function of time shows that the waveforms of the three vowel sounds are distinctly different. This is the most common type of display as captured by an oscilloscope or a computer display.

The second type of display shows the sound image as a function of frequency. This is an example of Fourier analysis, and these displays that show the amount of signal associated with each harmonic of the sound signal are called fast Fourier transforms, or FFTs. The FFT provides a way to quantify the differences in the harmonic content of the vowel sounds, and provides some insight into how the ear distinguishes these vowel sounds. With the insight provided by the place theory of pitch perception, it can be seen that the human ear's analysis of sound quality bears some resemblance to an FFT.

Index

Voice concepts

Musical instruments

Reference
Benade
Ch. 19
 
HyperPhysics***** Sound R Nave
Go Back