Sound Analysis
Physics 4060, Acoustics Laboratory
Musical sound is characterized by pitch, loudness, and quality. Pitch is frequency. The loudness of a given sound is determined by its intensity (power per unit area) factored by the sensitivity of the ear for that frequency. Quality or timbre refers to those sound characteristics which allow a person to distinguish sounds which have identical pitch and loudness. These distinguishing characteristics include harmonic content, vibrato, and attack/decay transients.
For sustained tones, the harmonic content is the dominant characteristic - and the determination of harmonic content is the point of this laboratory. To be more specific, "harmonic content" refers to the sound spectrum:the frequencies and relative intensities of the higher frequencies present in the sound, expressed as a fraction or percent of the intensity of the fundamental component. The fundamental is defined as the lowest resonant frequency of the vibrating object which produces the sound, and the terms overtone and harmonic are used to describe other, higher frequencies present in the sound. Overtone is the more general term, referring to any frequency component above the fundamental, but most overtones in musical sound are harmonics (integer multiples of the fundamental). Hence, determination of the sound spectrum usually involves identifying the harmonics and their relative intensity.
I. Procedure
The first step will be to produce a tape recording of sounds for analysis. Then the sounds will be analyzed by two different methods: (1) A/D Conversion with a Universal Laboratory Interface and the use of the Sound software accompanying it and (2) A/D conversion and discrete Fourier Analysis using the MacScope A/D Converter. As a final step, you will be given a pre-recorded sound which is supposed to contain only odd harmonics (characteristic of a cylinder with one end closed.) Your task is to analyze that sound, and then resynthesize it using a Fourier synthesizer and compare the sound of your synthesized version with the original.
Each person will be responsible for recording three sounds. You may bring a musical instrument if you wish, in which case you should record three different notes for the instrument at approximately the same dBA level. The sounds should be sustained as long as possible to facilitate analysis. Make note of the instrument used and the pitch if known ( i.e., concert pitch by frequency or letter name.) Alternatively you should use voiced vowel sounds. Select well defined vowel sounds and produce three sounds at about the same pitch and dBA level. It is helpful to think of a word and then sustain the vowel sound in that word. For example "AH" as in HOD, "EE" as in HEED and "OO" as in WHO'D.

II. Sound Analysis with the Universal Laboratory Interface
In this section of the experiment, you will make use of a sound capture routine with a microphone an the ULI. The steps required are
1. Run the Sound program for the ULI on one of the laboratory computers. Prepare it to capture a sound signal as follows:
a. Turn off the repeat mode: Use the mouse to position the arrow over Collect at the top of the screen. A menu should appear. Holding the mouse button down, move the pointer down to Repeat Mode and if there is a check mark beside Repeat Mode, release the mouse button there to take off the check. If there is no check, then Repeat Mode has already been turned off, so you should move the pointer back to the top of the screen before releasing the mouse button.
b. Choose "One Graph" from the Display menu by the same kind of procedure used above, i.e., display the menu and move the pointer over "One Graph" and release the mouse button.
2. Put the microphone of the ULI within a few centimeters of one of the loudspeakers of the sound console so that the produced sound from your tape will be strong compared to room background noise.
3. Play your tape and get a satisfactory sound level from the speaker. With your first sound playing, click start on the computer screen to capture a sound sample. A single sample will be collected at that time, but it will be a few seconds before it is displayed. Scale the waveform as necessary to see whether it is satisfactory and repeat if necessary.
4. Save the sound sample on your disc with a name which will identify it clearly - you will have to find it for the analysis. To save it, choose "Save Experiment as.." from the File menu. You will be prompted for a name, but after typing the name you must make sure the name of your data disk appears as the destination where the information will be saved. If you click the Desktop button, you should see your disk name on the list. Double-click the name to oper your disk. If you can't find it, ask for assistance.Then click on Save.
5. Repeat the capture and disc save operations for your other two sounds. You may now take your disc and complete your analysis on any of the laboratory computers by using the Sound program on any of them.
6. Experiment with the display of your waveform until you have a clear display of at least one cycle of the waveform (preferrably about four cycles) , scaled so that it nearly fills the display vertically as well as horizontally.
7. With your waveform display on the screen , choose Analyze A from the Data menu to display a vertical line on the screen. Using the mouse, position that line on the first distinct peak of the waveform and note the time. Then move it to the right to cover as many full periods of the wave as possible and note the corresponding peak time. Calculate the period and then the frequency of the sound. When you have finished this analysis, click the "Done" button on the screen to take you back to the standard display.
8. Click on the display of the wave with the mouse to select it and then choose Copy from the file menu to copy this display onto the "clipboard" of the computer. Find and open the wordprocessor (Word) by choosing its icon under the Apple menu (far left, top of screen). Then choose Paste from its file menu to paste in your waveform display. Then save this as a wordprocessor document. You will be adding to this file to compose your laboratory report. Note: make sure you don't use the same title for your report as for any of your data files - it will overwrite it. Be sure to save it on your laboratory disk (i.e., make sure the name of your data disk appears before clicking Save.) You will be adding to this file to compose your laboratory report.
9. Type a description of the sound in your wordprocessor file along with the waveform you have saved there, including your measured dBA level, the time data you recorded for determining the period, and the calculated frequency of the sound above the display. Choose Save from the File menu each time you make changes to keep your report up-to-date.
10. Repeat this process for your other two sounds.
11. Produce frequency analysis plots of each of your three signals by the following procedure:
a. Display the wave in the graph window. Click with the mouse at one peak of the waveform and hold the mouse button down while you drag diagonally across the graph to draw a dashed rectangle which encloses exactly one period of the wave. The display will change to display the selected range. You may refine the process to fit more accurately to one period if necessary.
b. With two quick clicks of the mouse on the graph (called "double clicking"), you will display the window for choosing graph scales. Place the mouse pointer over the small rectangular window to the right of "Type of Graph" and you will receive an option to choose Data or FFT. Move the pointer to FFT and release the mouse button. Click OK at the bottom of the window plot of amplitude versus frequency will be displayed. This is your sound analysis. Click on it with the mouse and choose Copy from the Edit menu to copy it to the clipboard. Open your wordprocessor document and paste this analysis in below your waveform display of this same sound. This may be done by clicking the mouse below the waveform to establish an entry point and then choosing Paste from the Edit menu.
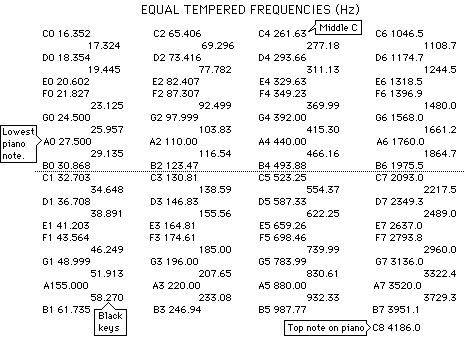
12. Compare your calculated frequencies in Hz with the Equal Tempered frequency chart and label the frequencies in your report with the nearest equal tempered note. The indented numbers are the sharps and flats.
III. Sound Analysis With the MacScope Interface
The MacScope interface offers a higher quality digitization of sound signals than the Universal Laboratory Interface used in the first part of this analysis laboratory series. The MacScope is to be used to digitize a sample from each of your three recorded sounds and to analyze the sound. The results are to be added to the wordprocessor file on your disk to complete your sound analysis report.
Procedure:
1. Play your tape and adjust the amplitude with the blue monitor control so that you get a waveform about 2 volts peak-to-peak (about 4 divisions peak-to-peak with the VOLTS/DIV set at 0.5).
2. Replay the tape and when you see the waveform, use the mouse to click the STOP/GO button on the MacScope screen. There is a delay before data appears on the screen - once it appears on the screen, click the STOP/GO button again to stop collection. An asterisk will appear (Stopped*) which shows you that data transfer to the computer is still going on. Wait until it disappears to proceed.
3. SAVE THE FILE IMMEDIATELY! (The software is very crash-prone, and saving the file will allow you to reconstruct it.) To save, choose "Save MacScope File..." from the File menu, give it a title, click the Desktop button and direct the Save to your disk. Use a name which you will recognize and which does not duplicate anything on your disk.
4. Use the slide bars and controls on the display to adjust it to almost full height of the screen and with at least two full periods showing in the window. The width of the waveform on the display is adjusted with the T slider at the top of the screen. The height is adjusted with the V slider to the right.
5. Use the mouse to carefully enclose precisely one period in a rectangle, observing the data box which is displayed on the screen so that you can write down the frequency of the wave for your report. That portion of the curve will be highlighted. Then choose Fourier Analysis from the Analyze menu. The harmonic amplitudes will be displayed in a bar graph below the waveform. Click on the Expand button to expand the display for the widest bars in the bar graph. You may need to use the V slider to readjust the waveform so that it will all fit in the window.
6. The display of the waveform and its analysis is to be made a part of your report. Move the mouse cursor off the display so that it doesn't show and then save an image of the screen by simultaneously holding down the Command and Shift keys and press 3 while those keys are still down. This will store a graphic image of the screen under the title screen0, screen1, or picture0, picture1, etc.
7. Before closing this data file write down the following data to include in your report:
a. The frequency you obtained from part 4 above. If you did not note it then, you can now redraw the rectangle over the same period and record that frequency.
b. Click on the FFT Data button to display the table of harmonic amplitudes. Write down just the harmonic number and the amplitude in the column next to it for all the harmonics which show amplitudes of .02 or more. Include a table of these amplitudes in your report with the graphical display saved above. (Alternatively, you can just take a picture of the data table and patch it into your report.
8. Close this data file and repeat the process for your other two sounds on the tape. To get back to the screen for collecting data as in Step 2, click the Scope button at the top of the display.
9. You must now transfer the graphic screen image files titled screen_ or picture_ onto your data disk. By default, they are stored on the hard disk of the machine. Find them and copy them to your disk by dragging their icons to your disk icon on the side of the screen.
10. Open your lab report file with the wordprocessor. Also open the graphic program DeskPaint by selecting it from the Apple menu (far left). Use DeskPaint to open the first of your Screen_ or Picture_ files. Use the dashed rectangle tool to draw a rectangle around just the waveform display and the Fourier analysis below it. Choose Copy from the Edit menu to copy this image. Then choose the wordprocessor from the extreme right hand menu to bring up your report and paste this graphic into your report. Add the frequency and harmonic amplitude data by typing it in below the display. Repeat for the other two screen files so that you have all three waveforms and the accompanying data in your report.
Below is an example of the type of display that should be a part of your report:

Waveform of voice, vowel "AH", 215 Hz
| Harmonic | Amplitude |
| 1 | 1.00 |
| 2 | .28 |
| 3 | .11 |
| 4 | .13 |
| 5 | .05 |
| 6 | .07 |
| 7 | .01 |
| 8 | .02 |
IV. Fourier Analysis and Synthesis
You will be using a simple Fourier synthesizer which is able to produce up to nine harmonics with variable phase. A recorded sound from a short closed organ pipe will be provided as a test case for Fourier synthesis.
First analyze the sound of the organ pipe using the MacScope A/D converter. Using the analysis of one period of the sound, extract amplitudes and phases for the harmonics present in the sound. Although we don't hav a precise way to control phase, you are match the amplitudes of the harmonics with the Fourier synthesizer and make some attempt to adjust the phase so that the waveform looks like that of the tape of the pipe sound. Listen to the two sounds and comment on their similarity or differences.