Sound Analysis II
MacScope Fast Fourier Transform
Physics 4060: Acoustics Laboratory
As another approach to sound analysis, the three pre-recorded tones from the previous will be analyzed using the MacScope digital sampling interface and the accompanying Fast Fourier Transform analysis software. The MacScope will be used at its fastest rate, a 20ms sampling time which corresponds to 50 kHz sampling rate. For comparison, the A/D samplers for the production of audio compact discs usually operate at a 44 kHz rate.
Play the tape of your sounds through the Peavy sound board and connect the Monitor output to the oscilloscope. Adjust the Monitor level (blue knob on right of console) so that the peak-to-peak voltage is about 2 volts. Branch the monitor output so that you can also connect it to input #3 of the Macscope.
If the Macscope software is not running, start it by double-clicking on the Macscope icon on the screen. It takes a minute or so for the software to load. Adjust the Amp to 2 by using the mouse and the pull-down menu at the top of the screen. Examine the Input menu and make sure #3 is selected. The Time menu should be set to Trigger and Automatic , which will set it to the maximum time resolution of 20 _s. In this configuration, the analog-to-digital converter will collect about 70 milliseconds of data, enough for several periods of your sound waveform.
To collect data, play the tape and listen for the desired sound. When it starts, click the Stop/Go button on the screen with the mouse. It will display "GOING" below the button and collect data until the data buffer is full. When it is finished, it will display "STOPPED". After examining the display to make sure than you have captured a sample, save the data file on an external floppy disc with a name which indicates the person and the sound, like JimFlute or JohnAh.
For each of your three sounds, the assignment involves displaying the waveform and doing an FFT analysis as illustrated in Figure 1 below.
The controls you have at your disposal to do this analysis are illustrated in Figure 2. After examining the data file, adjust the controls so that one waveform fills at least two-thirds of the screen horizontally so that you have sufficient resolution to accurately select one period of the sound. Carefully position the cursor at one recognizable peak and hold down the mouse button and drag the corner of the dashed rectangle which appears to the corresponding peak one period later. Before releasing the mouse button at the next peak, note the measured frequency which is displayed in the information box and make a note of it in your data. When you release the mouse, the period you have chosen will be displayed with a bold line. Now select FFT from the Analyze menu and expand the resulting bar graph as much as possible horizontally using the Expand button. At this point you should save the image of the waveform and FFT analysis you have done for your report. This can be done by holding down the Command and Shift keys simultaneously and pressing 3. This stores the screen as a "paint" document named Picture 0, Picture 1, Picture 2, etc. It will be a good idea to bring this saved file up on the screen using Deskpaint under the Apple Menu or Microsoft Word so that you can save it with a more descriptive title. You need to produce a print of this file for your report.
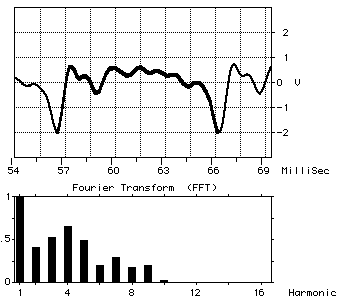
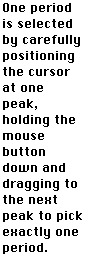
Figure 1: Waveform Display and FFT Analysis of "Ah" Vowel Sound
For each of your three sound samples the procedure is as follows:
1. For five periods in succession, perform the FFT and record the relative amplitudes of the first few harmonics - i.e., those which are greater than a few percent of the fundamental. Calculate average amplitudes and standard deviations for these harmonics and report these averages as your spectrum for this sound.
2. Record the amplitudes and phases of the significant harmonics of one period and then resynthesize the wave with a 50 point plot using the Excel spreadsheet on the lab Macintosh (or a spreadsheet of your own choice).
All of the components of your report can be put together with Microsoft Word and printed as a single document if you care to. Otherwise you can print out the various components and put them together in your report.
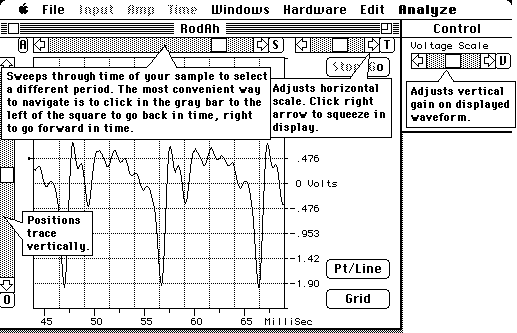
Figure 2: Controls used to adjust display of sound waveform.