Loudspeaker Analysis
Physics 4060, Acoustics Laboratory
In most cases the loudspeaker is the element which limits the fidelity of reproduction of a sound system. It is generally not economically feasible to build a loudspeaker which responds equally to all audio frequencies, i.e., which has a "flat" frequency response. In this lab, three methods for assessing the frequency response of a loudspeaker will be introduced. The industry standard methods for speaker analysis require an anechoic chamber, which is not accessible to us, so we will be limited to methods which can be used in an ordinary room.
Caution: Make sure you know which lead is the signal lead and which is ground before you make connections. Grounding a signal lead can damage the equipment.
I. Impedance versus frequency
The resonant frequency and some assessment of the overall response of a loudspeaker can be obtained from a graph of the voltage measured across the loudspeaker in the circuit of Figure 1. Using a resistance value R of

Figure 1. Impedance Method
about 200 ohms with an 8 ohm speaker keeps the load seen by the audio generator about constant. The output of the audio geneator should be kept constant as different frequencies are sampled. Then the voltage V will be proportional to the effective impedance of the speaker, including the back emf from the motion of the voice coil. The peak-to-peak voltage as measured on the occilloscope may be used. This voltage should show a peak at the resonant frequency and show any irregularities in impedance from the crossover network, etc.
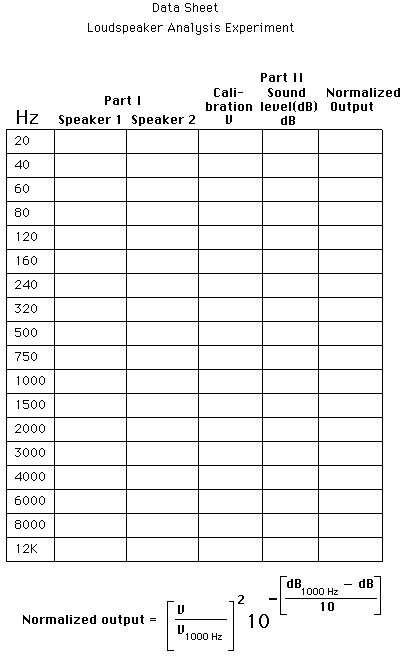
First do a plot of the response of the 'el cheapo' unenclosed loudspeaker provided, and then one of the small, enclosed loudspeakers. A data sheet has been provided to give you a set of frequencies to sample. In addition, search for the resonance and take several readings near resonance to get a good plot of the resonance peak. Look for any irregularities in response so that they can be shown on your plot. Plot the speaker response on semilog paper with frequency on the log axis and the vertical scale adjusted so that the resonant peak goes near the top of the paper. (The increase of voltage for high frequencies near 10,000 Hz is due to increasing inductive reactance of the voice coil and not an indication of enhanced speaker response at these frequencies.) Determine and record the "free cone resonant frequency" of each speaker if possible (if a speaker is good enough, its free cone resonance may be smoothed enough to obscure it.)
II. Direct Sound Output Method
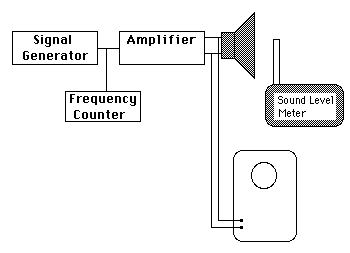
A sine wave generator will be passed through an audio amplifier which will drive the small enclosed speaker. The sound output will be measured with the sound level meter on the flat (20kHz) frequency response setting. The speaker output as a function of frequency can then be plotted.
Caution: A sine wave signal to a loudspeaker can burn out the voice coil of the speaker. Do not produce extremely loud sounds or hold the frequency constant for a long time in this experimental arrangement.
A reasonable procedure would be to produce a sound at some midrange frequency like 500 Hz and adjust that sound to something like 20 dB above the background level in the room. Monitor the output of the amplifier on an oscilloscope and decide on a standard peak-to-peak voltage to use as a reference. Then use that same output voltage for all other frequencies used for measurement. Scan through the frequency range, making measurements of speaker output at each of the frequencies indicated on the data sheet after adjusting the output voltage to your standard level on the scope. Measure the frequency with the use of a digital frequency counter before it goes into the power amplifier.
It is important to fix the positions of the speaker and the sound level meter for this experiment. The data reflect not only the speaker but also room effects, so at least the room effects should be kept as constant as possible. Normalize the speaker data to the calibration data using the expression at the bottom of the data sheet. Note that the values at 1000 Hz are used as a standard - this is an arbitrary choice of reference frequency, but relative values are all that are needed for the plot. If you use the same voltage at every frequency as suggested above, the voltage correction term will always be 1.

Figure 2. Direct Sound Output Measurement
III. Spectrum Analyzer Method
The Tektronix 5L4N Spectrum Analyzer can be used to perform the task of Part II quickly to get an overall view of the frequency response of a system.
Care must be taken: do not exceed one volt of input to the spectrum analyzer while while doing the calibration curve for the amplifier. Connect the white noise source directly to the amplifier and put the signal from the speaker output on the oscilloscope. Adjust it to 0.5 volts or less before connecting it to the analyzer. The frequency bandwidth should be adjusted to show frequencies as high as 10 kHz. Take an oscilloscope picture of the distribution of power vs frequency.
Connect the speaker to the amplifier and put it in the same place as in Part II if possible. Adjust it for a sound level at least 10 dB above background. Connect a 1/4" phone jack lead from the sound level meter to the oscilloscope and change the sound level meter range switch until the level is below 0.5 volts. It will not matter that you can no longer read the sound level meter - you are just using its microphone. Don't change the sound level meter range during data collection -- this changes the output level and could overdrive the analyzer. Take this signal into the sound analyzer and take a polaroid picture of the display for comparison to the amplifier output.
