Microwave Spectroscopy Laboratory
April, 1971
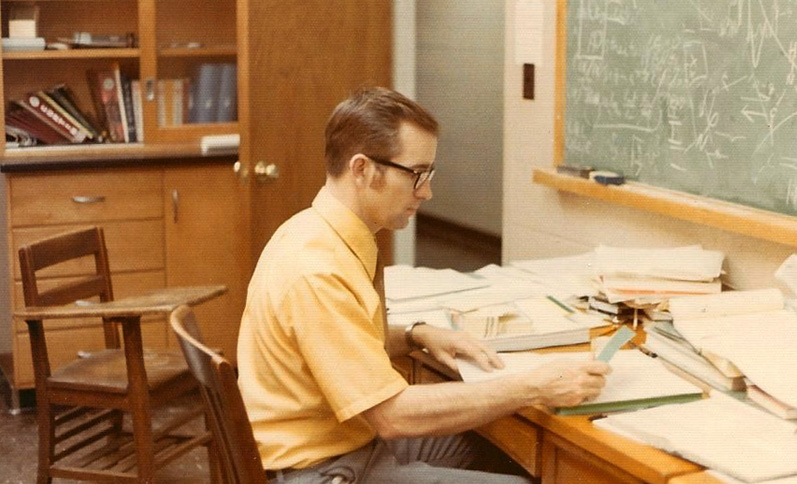
When Rod joined the faculty of the Department of Physics at Georgia State College in 1968, he was commissioned to build a microwave spectrometer to do molecular structure research. He proceeded to do so, but some of the early projects with his spectrometer were for Senior Research projects for advanced undergraduate students. This discussion of the then current microwave spectrometer on the 5th floor of Kell Hall follows the report by A. C. Griffin of his Senior Research Project, completed in the spring of 1971. These are the earliest pictures of the laboratory equipment that I have found.

This set of instruments contains the source of the microwave energy which is transmitted down an evacuated waveguide about 15 feet long and detected on the far end to measure the amount of absorption of the microwave energy. The tunable microwave source is called a Backward Wave Oscillator (BWO) and its frequency is too high to measure directly. It is measured by generating high harmonics of a precise standard oscillator and mixing a chosen harmonic with the microwaves to produce a beat frequency in a range which can be measured with a frequency counter. A frequency accuracy of a few parts in a million is attainable, and in fact necessary for the precision required to study molecular structure. The particular instruments shown in the illustration above are:
- Hewlett Packard Model 8709A Synchronizer.
- Hewlett Packard 431C Power Meter.
- Hewlett Packard model 8466A Reference Oscillator, range 240-400MHz.
- Hewlett Packard model 8708A Synchronizer
- Hewlett Packard model 8690A GHz sweep oscillator (housing and controlling the BWO microwave source)
- Hewlett Packard model 5252A "prescalar" frequency counter.
- Hewlett Packard model 7127A strip chart recorder including Hewlett Packard model 8429 frequency marker.
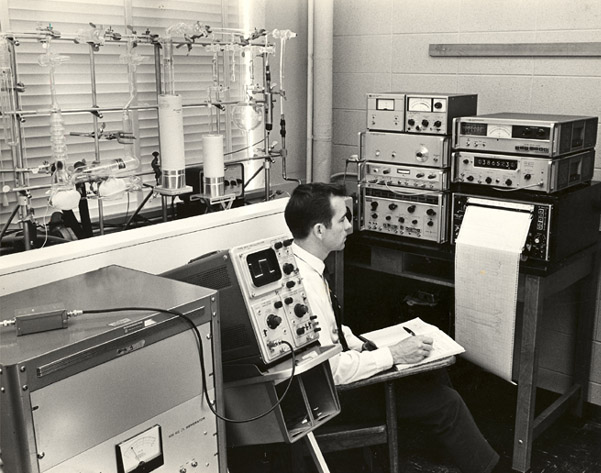
The sweep oscillator (5) produces microwaves which follow two paths: One is fed to the waveguide via a crystal mixer, and the other is synchronized with the nth harmonic of the reference oscillator(3) which in turn drives the counter(6).

The glass vacuum system provides the low pressure environment for sample handling and introduction into the waveguide for the microwave absorption measurements.
- A two-stage glass oil diffusion pump provides the pumping to obtain and control the sample pressure in the waveguide system. Prior to the diffusion pump there is a mechanical pump which does the bulk of the pumping down from atmospheric pressure.
- A variety of vessels which can hold liquid or gaseous samples under controlled pressure. With stopcocks, a gaseous sample can be introduced into the glass manifold.
- Typically, liquid nitrogen or dry ice is used in cold traps to "freeze out" the sample to be studied. The air is pumped out of the system, and then the sample warmed enough to allow evaporation of the sample into the vacuum system and waveguide.
- A Pirani gauge and accompanying display device is used to measure pressure. Pressures of about 100 milli-Torr were typical for this research project.
- The vacuum system is attached to the long hollow waveguide so that the gas to be studied can be introduced into the waveguide. That produces a long path through the gas to absorb the microwaves. The microwaves enter and exit through mylar windows which are transparent to the microwaves.
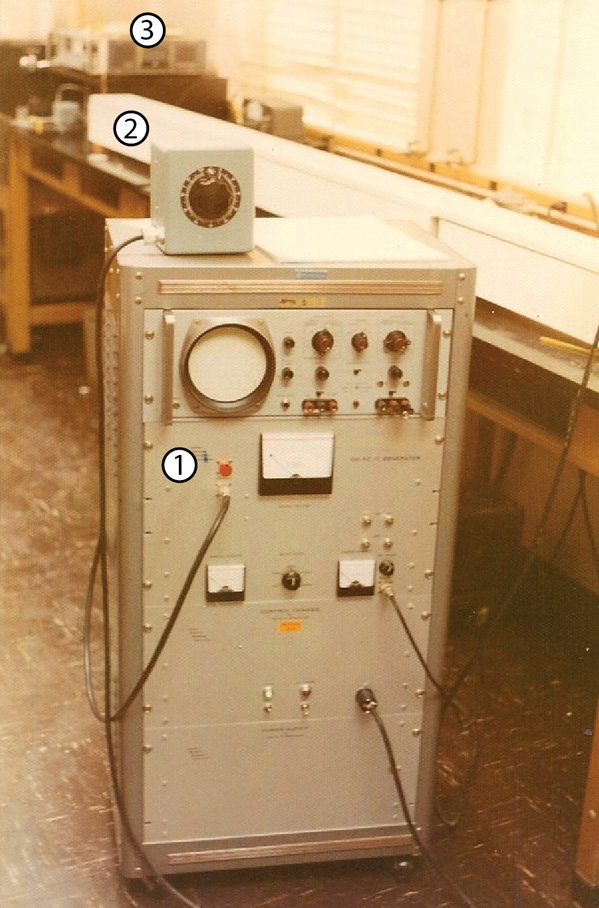 | Square-Wave Generator for Stark Modulation
|
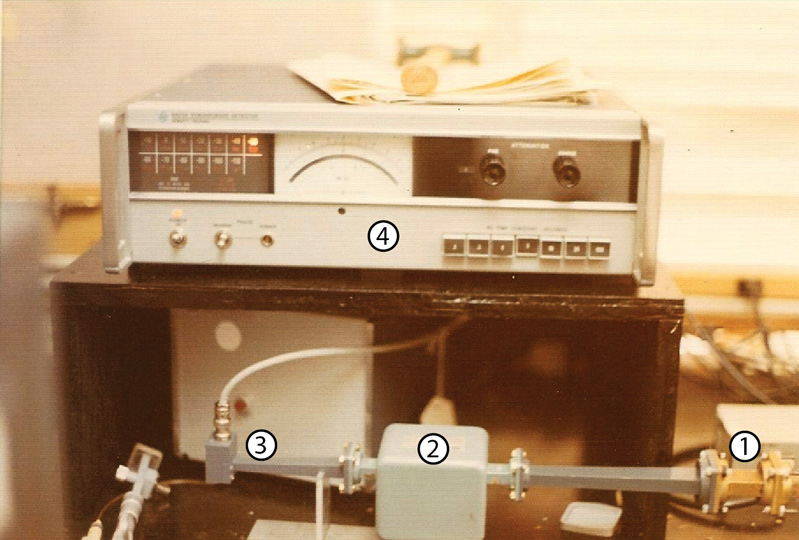
At the far end of the long hollow waveguide are the electronics that detect the microwaves that reach them. Molecular absorptions associated with quantum jumps in rotational energy for the molecules produce a 33kHz signal because of the Stark modulation of the absorptions as discussed above. Those absorption signals are sent back to the chart recorder at the beginning end of the spectrometer.
- End of the long waveguide with the sealed flanges that hold the vacuum but transmit the microwave energy.
- Isolator to keep the microwave energy from reflecting back up the waveguide.
- Detector crystal for detecting the microwave energy.
- Hewlett Packard 8420A synchronous detector. It converts the detected 33kHz signal which represents molecular absorption into a DC signal which is fed to the strip chart recorder shown in the first diagram above.
 | Rod developed the microwave spectroscopy laboratory during those first few years, but the earliest photograph of the spectrometer that could be found after 1971 was in 1978 |
Flashback to Bangor, North Wales in the Chemistry Department of the University College of North Wales
The microwave spectrometers used as models for the development of Rod's spectrometer at Georgia State University were at Georgia Tech in the early 1960s during his thesis work and the images below during his Post-Doctoral year in Wales in 1966. The images below are from 1966.
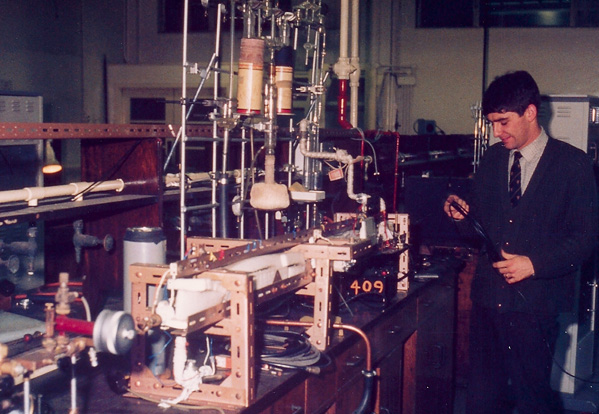
Chemistry graduate student John Griffith works with the glass vacuum system which is used to let the gases to be studied into the copper waveguide. There they were subjected to microwave energy to measure the frequencies at which the rotating molecules absorbed microwaves. From those absorption frequencies could be calculated bond lengths, angles, and other structural information about molecules, a "molecular microscope".
|
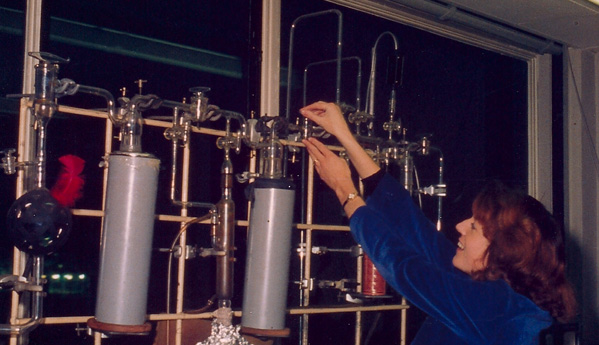
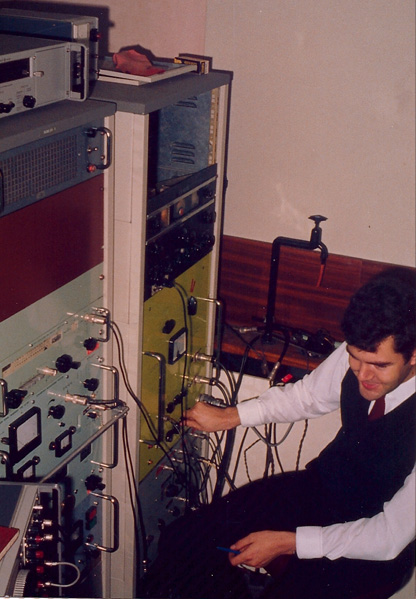
Above, Valerie Williams adjusts the glass vacuum system which allows the gas to be studied into the experimental waveguide chamber. Graham Williams and his wife Valerie were both graduate students in chemistry. They were working on Ph. D. theses in microwave spectroscopy. Graham is working with some of the electronics which produces and controls the microwave radiation to send down the waveguide and through the sample gas. |
 |
| Jeff's 3rd Birthday |
1971