HyperPhysics Poster Presentation
1996
At the American Association of Physics Teachers meeting in Maryland, just outside Washington, DC, I exhibited what I think was my first formal presentation about the idea of HyperPhysics that I was working on.
Since about 1986 in my Conceptual Physics course, I had nurtured the dream of creating a computer-based exploration environment to help teachers of physics and physical science. The computer tools kept developing, and I had made use of early editions of Adobe Illustrator to produce graphics that I could display on a computer screen. Then about 1990 I was introduced to HyperCard on the Macintosh which would allow me to develop screen displays with calculations and also produce active graphics that I could click on to navigate to another screen. About that time I served on the Science Education Doctorate committee of Bill Pankratius who did his thesis on the use of concept maps in teaching physics, following the work of Joseph Novak who wrote "Learning How to Learn". Novak explored the use of concept maps in education, and I was quickly hooked. It seemed like a good way to navigate to different topics or to "drill down" to deeper levels on a given topic. With my learning of HyperCard with the aid of AAPT workshops like that in Boise in 1993, I was able to put together a coherent framework. I was ready to make active concept maps and use active "hypertext" that could be clicked upon to go to the indicated location or subject.
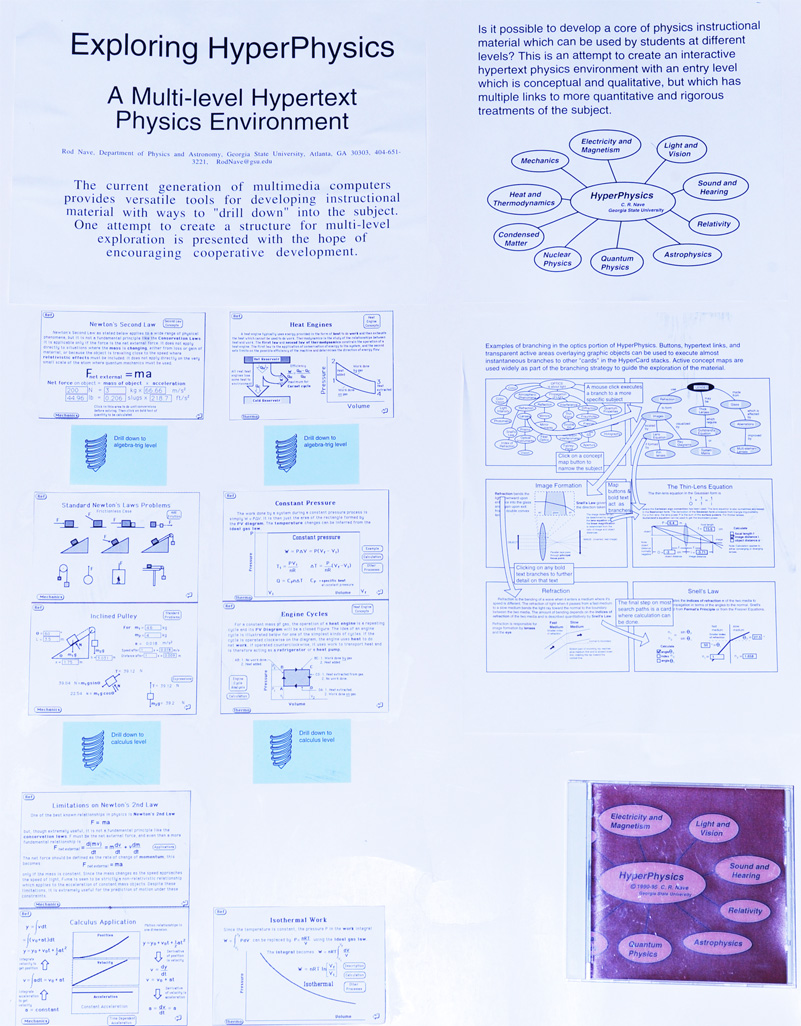
 | By 1996 I had developed a considerable body of physics instructional material in the form of HyperCard "Stacks" as they were called. They were collections of screen images that could be linked together and navigated like a stack of cards.
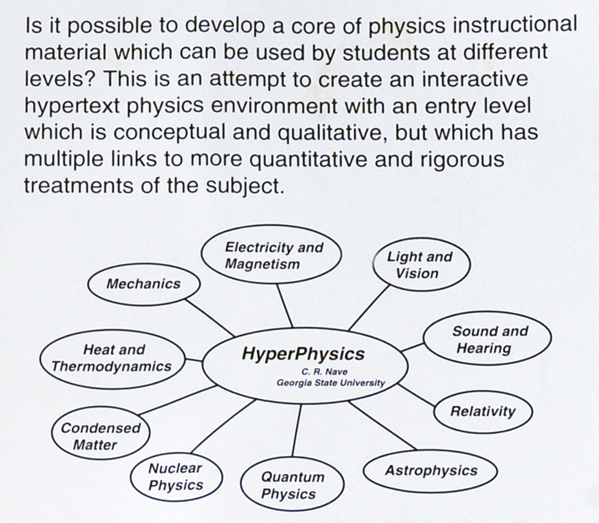
The use of Adobe Illustrator in its current versions allowed me to draw smooth graphics, a big improvement over the "black and white jaggies" that were the state of the art just a few years previous. This was my ambition, to develop a body of interrelated physics information on these ten divisions of physics and astronomy. This basic home diagram has continued to the present version of HyperPhysics. I had a lot of discussions with Scott Owen of Computer Science in those days. I shared my dream with him, and he was encouraging but thought it was too ambitious. |
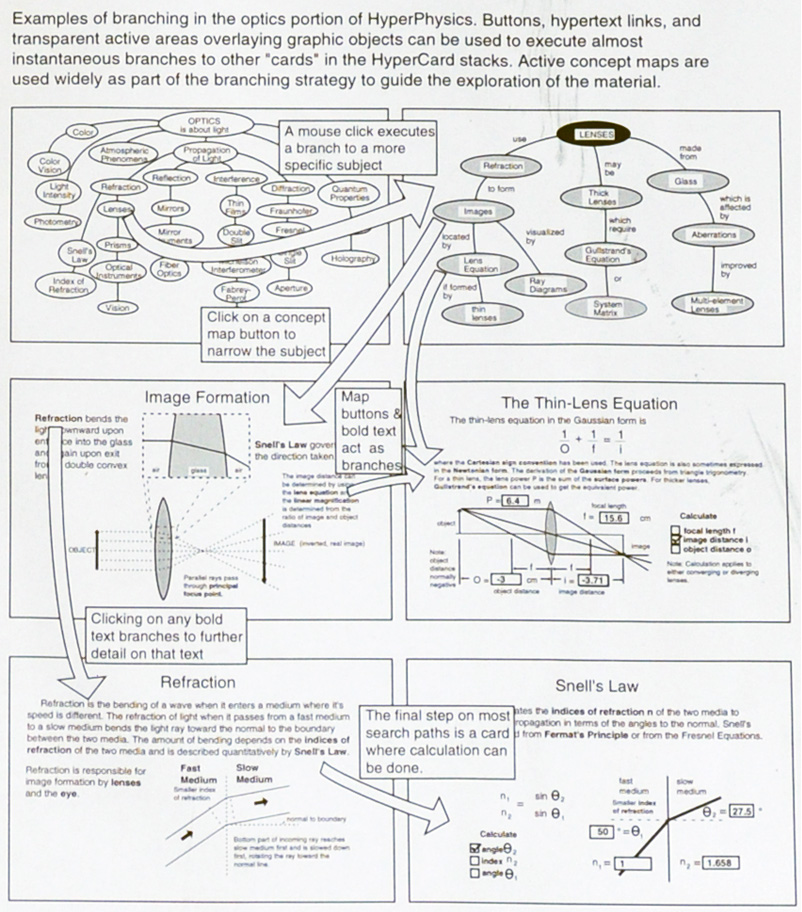
Since I had regularly taught our optics course from about 1990 when I was learning the computer tools, many of my more ambitious projects were in optics. I developed a rather detailed concept map for optics which could be reached by clicking on the Light and Vision oval in the home concept map above. That brought up the optics concept map, and all the ovals in it were also active to take you to the indicated topic. The illustration above shows that I had developed the capability for doing rather smooth graphics to illustrate the subject. That illustration showed that a click on Lenses in the main optics concept map would take you to a more specific concept map for lenses, and clicks on Images or Lens Equation would take you to those specific topic. I called this process "drilling down" for the purpose of this presentation. By this stage I was able to make the bold-faced type active as "hypertext" to branch off to more specific information. You can see that continuing to "drill down" got you to a place where you could plug in numbers and do calculation. HyperCard was the first computer environment I had encountered which allowed you to do active calculation associated with the graphics.
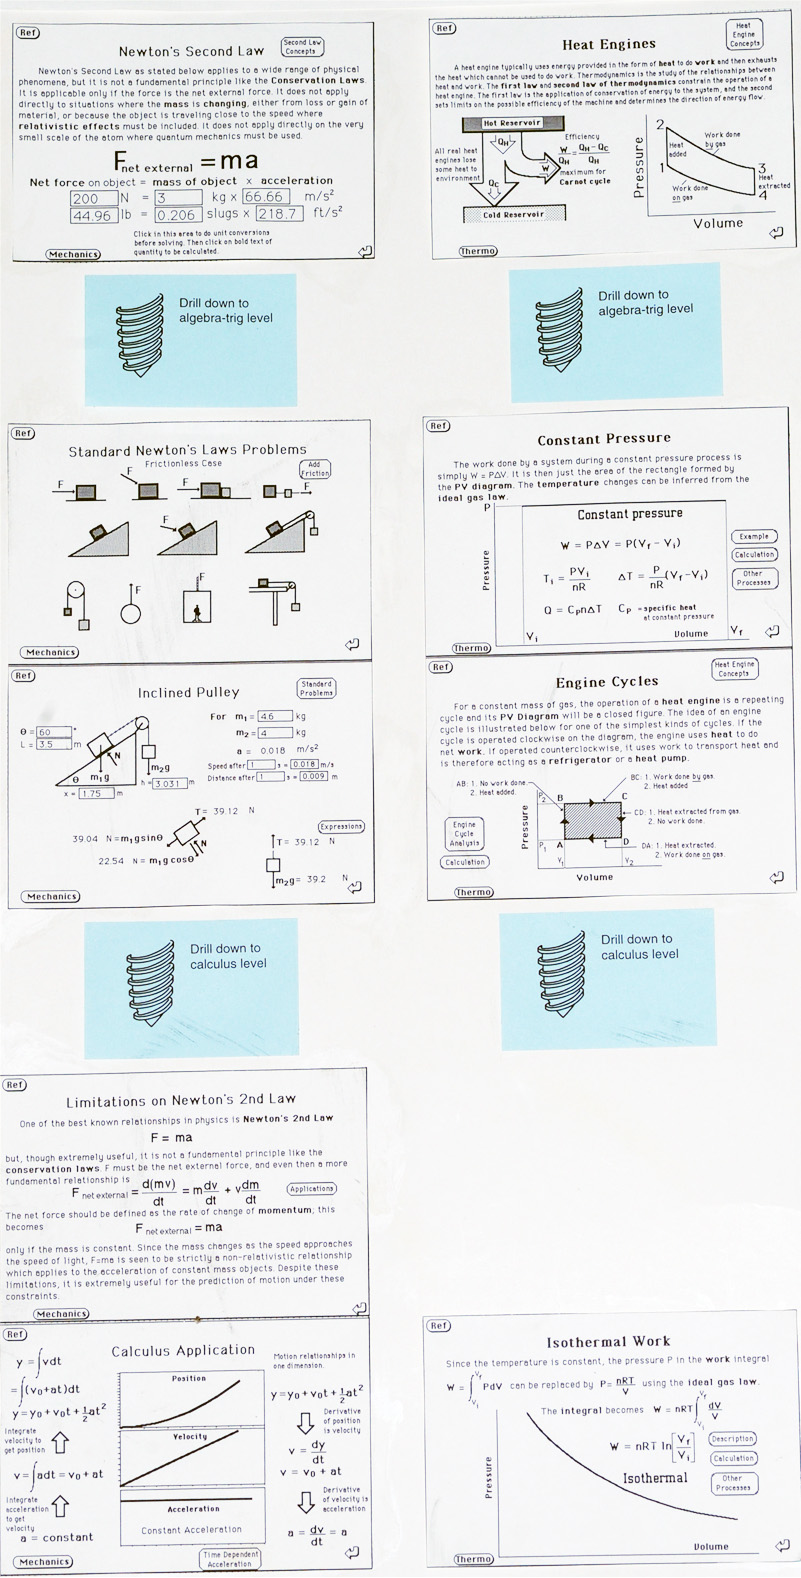
The main theme of my poster was "drill down", showing that with the active graphic and text links, one could start at an elementary level and continue to drill down to more advanced treatments of the topics. I used mechanics and thermodynamics as examples.
1996