Correlation of global temperature with solar activity
The solar output is very nearly constant, as shown in the plot below. The range of variation is about 0.2%, so reproducible that it is often referred to as the "solar constant".
But there are other aspects of the Sun's activity that are not constant, as indicated by the changing sunspot activity.
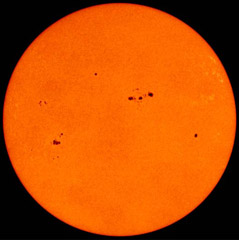 | An early indication that the Sun's variability in ways other than total output had something to do with climate was the "Maunder Minimum". The researcher Maunder found that during this cold period between 1645-1715 there was very little sunspot activity, and this discovery led to the naming of the phenomenon after him. It suggested that solar activity was coupled to climate and led to tabulations of sunspot number as an indication of solar activity. |
This illustration is a sketch of data from Durkin, based on data published by Friis-Christensen and Lassen. The end of the solar data has been altered in response to corrections of their data. This correlation between solar activity and temperature has been critiqued by Schneider and others, so it is an active area of investigation. The measured solar activity is well-correlated with the observed temperature variations, but does not follow the recent upturn in temperature as the originally published plot indicated.
While it appears that the measured solar cycle length tracks the temperature better than the CO2 concentration for the twentieth century up to 1970, this presented data remains quite controversial. When you look at the climate models that seek to show the human influence past 1970, you do see a good correlation of the temperature with the projected CO2 influence included, while the correlation with solar cycle length weakens.
 | The illustrations at left show the raw data for temperature and solar activity at the top, then that data with a 11 year running average to filter out the normal solar activity period. The middle graph suggests a correlation between solar activity and temperature, even though the peaks are offset. But when the last few years of data are included, the curves diverge and severely weaken the case for the driving of temperature by this measure of solar activity. These illustrations were prepared by Chris Merchant, School of GeoSciences, University of Edinburgh from the original data. |
The above illustration from Wikipedia shows some of the solar measurements as a function of time. The dominant fact from that illustration is that the overall solar output is incredibly constant -- varying only about one part in 1366! But the other variables are measured on a relative scale and represent much larger percentage variations, so it is possible that the solar flare index and the sunspot observations are windows to subtle influences on the Earth's climate that we don't understand.
Another solar activity correlation that is being investigated is that with cosmic radiation and its possible effect on cloud nucleation.
| Skeptical views of CO2 driven global warming |
References
Collins, et al.
Durkin
Friis-Christensen and Lassen
| HyperPhysics***** Thermodynamics | R Nave |