Solar Iradiance

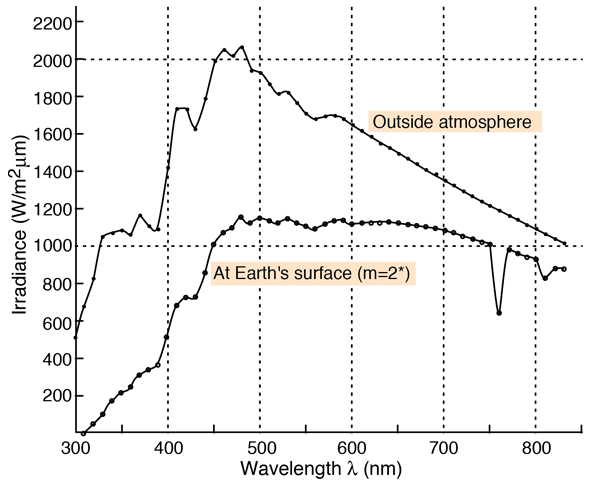
This is a plot of the standard NASA data for the spectral irradiance of the solar disk in Watts/m2μm. The upper curve is formed by joining the data points for data outside the atmosphere. The lower curve is attributed to the Earth's surface under the condition described as "air mass 2". This designation corresponds to an angle of 60° between the zenith and the Sun. The data for the surface is from Brandhorst, et al., Interim solar cell testing procedures for terrestrial applications, NASA Rep. TM X-71771 (Lewis Research Center) 1975. The points are actually calculated using the data from outside the atmosphere assuming a water content of 20 mmHg and ozone 3.4 mm Hg. The data for outside the atmosphere is from Thekaekara, M. P., Solar energy outside the earth's atmosphere, Solar Energy 14, 109 (1973).

This represents a later assessment of the solar irradiance shown in red. This is also a NASA illustration with calculations of spectral line features credited to Bob Kurucz of Harvard Smithsonian Observatory. It is characterized as the best post-1992 solar spectrum estimate.

The iradiance outside the atmosphere can be compared with the blackbody curve at 6000K, a portion of which is reproduced at right. By examining the 400-700 nm nominal range of visible light, you can see that the solar irradiance is similar to that of a blackbody radiator. The curve at the surface is noticeably flatter, or more "white" if you take equal energy per wavelength as a definition of white.
Wavelength
l(nm)
Outside
atmosphere
Surface
m=2
Wavelength
l(nm)
Outside
atmosphere
Surface
m=2
300
514
0
570
1712
1134
310
689
1
580
1715
1147
320
830
50
590
1700
1148
330
1059
105
600
1666
1135
340
1074
177
610
1635
1137
350
1093
217
620
1602
1137
360
1068
255
630
1570
1137
370
1181
320
640
1544
1141
380
1120
344
650
1511
1140
390
1098
371
660
1486
1136
400
1429
530
670
1456
1127
410
1751
693
680
1427
1119
420
1747
737
690
1402
1114
430
1639
737
700
1369
1102
440
1810
867
710
1344
1089
450
2006
1022
720
1314
1071
460
2066
1089
730
1290
1058
470
2033
1107
740
1260
1040
480
2074
1167
750
1235
1026
490
1950
1133
760
1211
660
500
1942
1165
770
1185
997
510
1882
1147
780
1159
981
520
1833
1136
790
1134
965
530
1842
1159
800
1109
950
540
1783
1140
810
1085
850
550
1725
1120
820
1060
900
560
1695
1111
830
1036
898
Blackbody curve at 6000K
Index

Vision concepts

Color vision

Reference
Wyszecki & Stiles
Ch 1
 
HyperPhysics***** Light and Vision R Nave
Go Back


The Solar Constant

The amount of solar energy reaching top of the Earth's atmosphere per square meter on a perpendicular area is often called the solar constant. The nominal value for the solar constant is

Solar Constant = 1366 watts/m2

For the total cross-sectional area of the Earth, the power received is about 1.74 x 10¹⁷ watts. The Sun's output power is about 3.86 x 1026 watts. The amount of power received from the Sun does vary with sunspot activity, but the variation is rather small as indicated by the following time plot.

The source for the above curve was http://www.pmodwrc.ch/pmod.php?topic=tsi/composite/SolarConstant . It represents an average of data from several satellites and was developed by World Radiation Center PMOD (Physikalisch-Meteorologisches Observatorium Davos) of Switzerland.

The actual measured solar irradiance varies with the altitude and orientation with the Sun.

Blackbody curve at 6000K
Index

Vision concepts

Color vision
 
HyperPhysics***** Light and Vision R Nave
Go Back