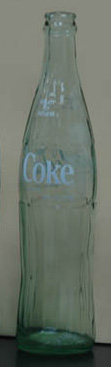
Coke Bottle Resonance
The cavity resonance frequencies of a 0.5 liter glass coke bottle were recorded by blowing over the top of it and measuring the frequency using a microphone and a digital frequency counter.
C* = constant for this experiment. |
| Frequency | Volume |
| Hz | cm3 |
| 355 | 100 |
| 310 | 125 |
| 280 | 150 |
| 256 | 175 |
| 239 | 200 |
| 225 | 225 |
| 212 | 250 |
| 202 | 275 |
| 193 | 300 |
| 185 | 325 |
| 178 | 350 |
| 171 | 375 |
| 165 | 400 |
| 161 | 425 |
| 156 | 450 |
| 152 | 475 |
| 146 | 500 |
| When the resonant frequency is plotted as a function of the inverse square root of the volume, a straight line plot is obtained. This shows that the frequency is proportional to the inverse square root of volume. 
|
The calculated frequency of a resonant cavity depends upon the speed of sound v. It also depends upon the square roots of three physical parameters: the area of the opening A, the volume of the cavity V, and the length of the opening port L. The quantity C* indicated in the top graph includes the factors other than the volume which are held constant for these measurements.
|
Index
Wave concepts
Resonance concepts |