Physics 4060: Acoustics Laboratory
I. Decibels
Because of the large range of power associated with audible sound (1014 or larger) it is customary to use the logarithmic decibel scale for sound intensity measurement. The decibel level is defined by

where I = sound intensity = sound power per unit area (watts/cm2 is a typical unit).
The reference level for such measurements is
I0 = the intensity for the standard threshold of hearing at 1000 Hz = 10-16 watts/cm2.
By examining the definition when I0 is inserted for I, giving a 1 in the logarithm, you can see that the level I0 is zero decibels. The threshold of pain is about 1013 I0 or 130 decibels. Normal music is 40dB-100dB and conversational speech about 75dB.
The just noticeable change in sound intensity is about 1 decibel. Doubling the power of a source increases the sound level by 10 log10(2) = 3 decibels. This is not as dramatic a change in loudness as you might expect from power doubling - the ear's loudness response is approximately logarithmic. This might be borne in mind if you consider paying a lot more money for a 70 watt stereo rather than a 50 watt - the perceived loudness difference is slight. Subjective experiments have indicated that for a given sound the intensity must be increased by about 10 decibels to be perceived as twice as loud - a tenfold power increase!
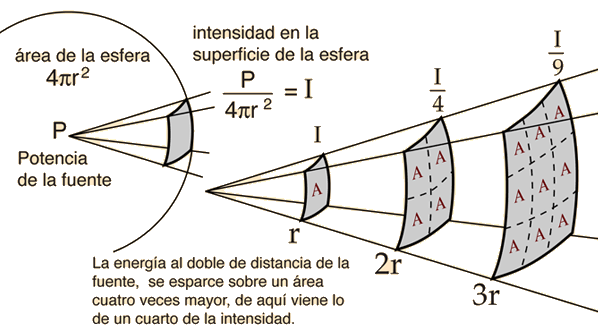
In an open area with no reverberation, the sound intensity from a point source will drop off according to the inverse square law:

If the distance from the sound source is doubled, the intensity is down to one fourth, so

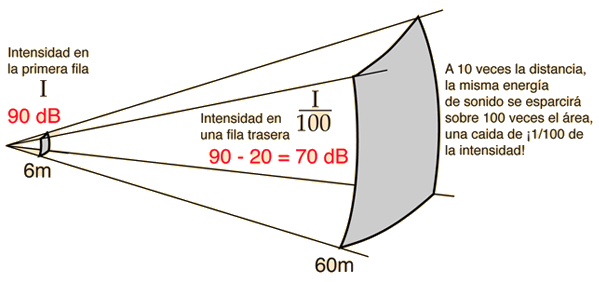
A doubling of distance from the source should give you a 6 dB drop if the inverse square law holds. (Note that decibels can be used to express any sound ratio in addition to the use for comparing to hearing threshold.) If the sound intensity in an auditorium followed the inverse square law, there would be a 20 decibel drop from the nearest listener to the most distant one if the nearest were at 10 ft and the most distant at 100 ft:

In any real environment - at least in any enclosed room - reverberant sound and background sound are always present and the inverse square law does not apply. If the intensity of the sound source is much greater than the background, then the sound near the source may approximate inverse square drop off- this region is often called the "direct sound field". At larger distances from the source in an acoustically "live" environment, the sound level may have little variation with distance because the room may be filled with the "reverberent sound field".
II. Use of Contour Filters
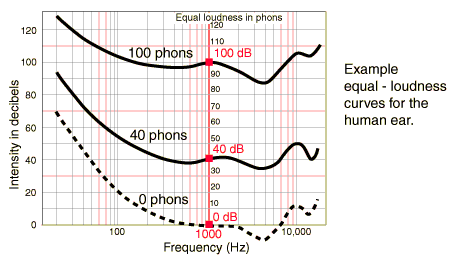
Sound intensity and sound "loudness" are not the same - there is not a one-to-one correlation. Two sounds of the same intensity will not in general be perceived by the human ear to have the same loudness unless the two sounds are the same pitch and of identical frequency content. The origin of this difficulty is the fact that the ear's sensitivity is strongly frequency dependent, as indicated by example contours from the human hearing curves sketched below.

Sounds below 100 Hz frequency are strongly discriminated against by the human ear, yet are very important for musical sound. If there is a lot of low frequency content in a sound, then a straight decibel measurement will be quite misleading if you are trying to assess loudness. A 50 dB, 1000 Hz sound will be significantly louder than a 50 dB, 100 Hz sound -- the 100 Hz sound will be barely audible. The relative loudness perception of different frequency sounds is further complicated by the fact that the response curves of the ear change with loudness level. Note that the equal loudness curve for 100 phons in the diagram above is considerably flatter that the curve for 40 phons. The human ear discriminates more and more against very low and very high frequencies as the sound gets softer. The "phon" is a unit of loudness so that a 40 phon curve is an equal-loudness curve for sounds which sound the same loudness as a 40 dB, 1000 Hz tone.
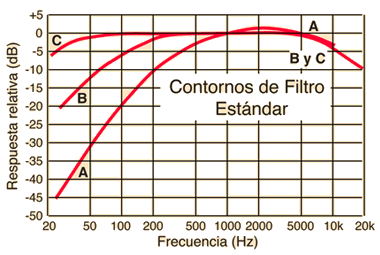
Since the human hearing response is non-uniform, standard contour filters have been developed which approximate the human hearing response. The three international standard contours are denoted A,B,C and measurements using them are denoted dBA, dBB, and dBC. These filter contours are roughly sketched below to illustrate their relative discrimination against very low and high audible frequencies.

The A contour is the most commonly used contour for the measurement of musical sound loudness, since it most accurately approximates the human hearing response for sounds of medium loudness. Note from the equal loudness curves that the hearing curve is flatter at very high sound intensity levels, so that contours B and C might be more appropriate for monitoring loud sounds. C is sometimes used for traffic noise surveys. For most purposes a survey of flat dB and dBA measurements constitutes a practical assessment of the sound field.