Blood Pressure
The flow of the blood through the human circulatory system is powered by the heart according to a basic flow relationship where the volume flowrate of the blood is equal to the effective fluid pressure divided by the resistance to flow. Far from being a simple pipe system, the circulatory system proceeds through a branching arterial system through a capillary system and back to the heart through the venous system. The beating of the heart provides a pressure pulse that drives the blood through the very flexible circulatory vessels. One of our most readily available parameters to assess this circulation process is the blood pressure.

For a rigid pipe system to which was applied a sudden pressure, the pressure would rise suddenly, and drop suddenly to zero when the pressure was switched off. The human circulatory system is quite different. You get a pulse of pumping pressure with the depolarization of the heart's ventricle muscles, but the pressure reaching the arteries of the arm where pressure is typically measured rises more gradually in this elastic system of arteries. The pressure at the point of measurement reaches its peak (systolic pressure) after the pumping pulse is completed, and then begins to drop. But because of the elastic recoil of the arterial vessels, it drops gradually and does not reach zero - the low pressure is called the diastolic pressure. |  |
Since the static fluid pressure of a liquid is proportional to its depth, then the depth of the liquid is a good measure of the pressure. Common pressure measurements are made with a liquid column called a manometer, and the pressure is typically stated in terms of the height of the liquid column. The standard barometers for measuring atmospheric pressure (standard 760mmHg) and blood pressure measurement devices have typically used mercury as the liquid, and a common systolic blood pressure is 120mm of mercury (120 mmHg) and a common diastolic pressure is 80 mmHg.
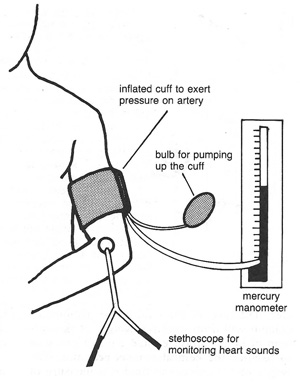
Shown above is a standard way of measuring blood pressure by putting a pressure cuff on the arm and pumping it up until it has a pressure greater than the systolic pressure of the person. This apparatus, called a sphygmomanometer, has a tube providing that pumping pressure to a mercury manometer. Then the person measuring the pressure listens with a stethoscope while the pressure is lowered gradually. As an application of Pascal's law, the pressure in the system transmits to all parts of the enclosed system, and since it is pumped up higher than the systolic pressure, it cuts off the arterial blood flow. As it drops below the systolic pressure, the blood starts moving through the artery in pulses so that you can hear the point of flow initiation as the systolic pressure. As you continue to lower the pressure, the pulse is still audible as the flow is interrupted for part of the cycle and audible turbulence is heard. As the pressure drops below the diastolic, the flow is no longer stopped and the flow smooths out to more like laminar flow. You can hear the change in quality of the sound at that point as the measurement of the diastolic pressure. Measurement of the diastolic pressure is somewhat more subtle because it involves a change in the quality of the sound.

When you correlate the pattern of blood pressure variation with the electrical signal from the ECG, you can see the sharp pattern of the QRS complex associated with the depolarization of the ventricles. The associated contraction of the ventricles gives the pumping pulse of pressure to the blood and the pressure begins to rise at the point of measurement.
 | This block diagram of the circulatory system shows typical systolic pressures in different parts of the system. |
While the typical measured blood pressure systolic/diastolic = 120/80 mmHg provides useful information for medical diagnosis and care, the blood pressure varies throughout the system.
|
Monitoring the pressure drop across different parts of the circulatory system provides a measure of how much energy is used for each part since the total volume flowrate is about 5 liters/min through the system. The estimates at left are from Burton based on projections from animal studies. It is somewhat surprising that the pressure drop across the arterioles is larger than that for the capillaries since by Poiseuille's law the resistance varies as the fourth power of the vessel radius, but there are many more capillaries which provide a lower overall resistance to flow. This also reflects the fact that the radii of the arterioles may be changed by muscles that surround them to control the blood flow to locations in the body that are more in need of the oxygen and nutrients. | ||||||||||||||||
Health- related concepts
Fluid concepts
Nave & Nave
Ch. 7
Burton
Physiology and Biophysics of the Circulation
| HyperPhysics***** Mechanics ***** Fluids | R Nave |