Atomic Spectra


Neon spectrum
Argon
Hydrogen
Helium
Iodine
Nitrogen
Neon
Mercury
Sodium

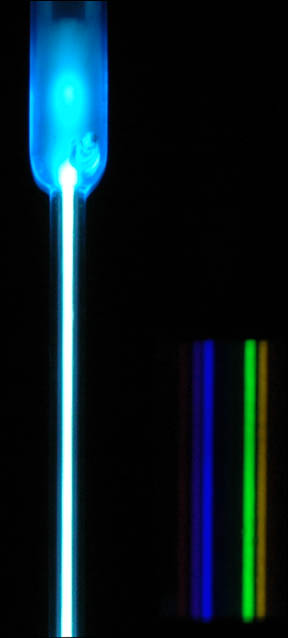
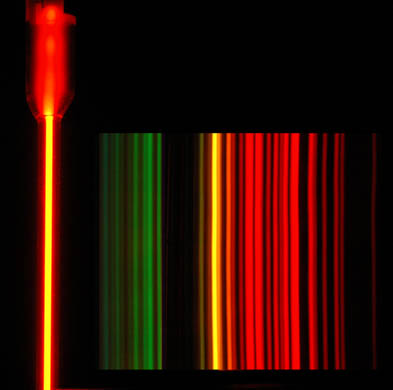
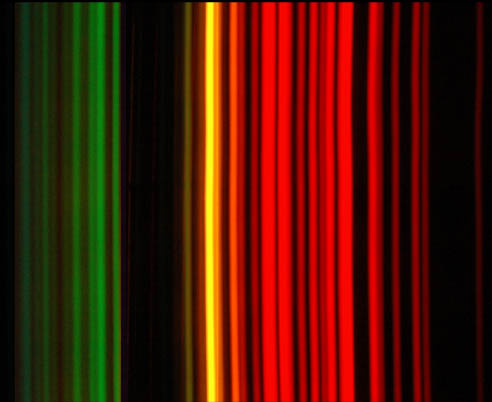
This is an attempt to give a reasonable accurate picture of the appearance of the neon spectrum, but both the images are composite images. The image below is composed of segments of three photographs to make the yellow and green lines more visible along with the much brighter red lines. Then the image below was reduced and superimposed on the image above, because with the exposure reasonable for the bright tube, only the red lines were visible on the photograph.

Some of the visible lines of neon:

l nm
Color
540.1
green
585.2
yellow
588.2
yellow
603.0
orange
607.4
orange
616.4
orange
621.7
red-orange
626.6
red-orange
633.4
red
638.3
red
640.2
red
650.6
red
659.9
red
692.9
red
703.2
red
This is a section of the sign shown below, which has a central neon section and another gas mixture producing blue light around it. Such signs are excited by voltages of a few thousand volts produced by a transformer that raises the voltage of the ordinary AC line voltage.
Index
 
HyperPhysics***** Quantum Physics R Nave
Go Back


Atomic Spectra


Mercury spectrum
Argon
Hydrogen
Helium
Iodine
Nitrogen
Neon
Mercury
Sodium

At left is a mercury spectral tube excited by means of a 5000 volt transformer. At the right of the image are the spectral lines through a 600 line/mm diffraction grating.

The prominent mercury lines are at 435.835 nm (blue), 546.074 nm (green), and a pair at 576.959 nm and 579.065 nm (yellow-orange). There are two other blue lines at 404.656 nm and 407.781 nm and a weak line at 491.604 nm.

Hologram viewed wih mercury light
Index

Reference
Jenkins & White
Ch. 21
 
HyperPhysics***** Quantum Physics R Nave
Go Back